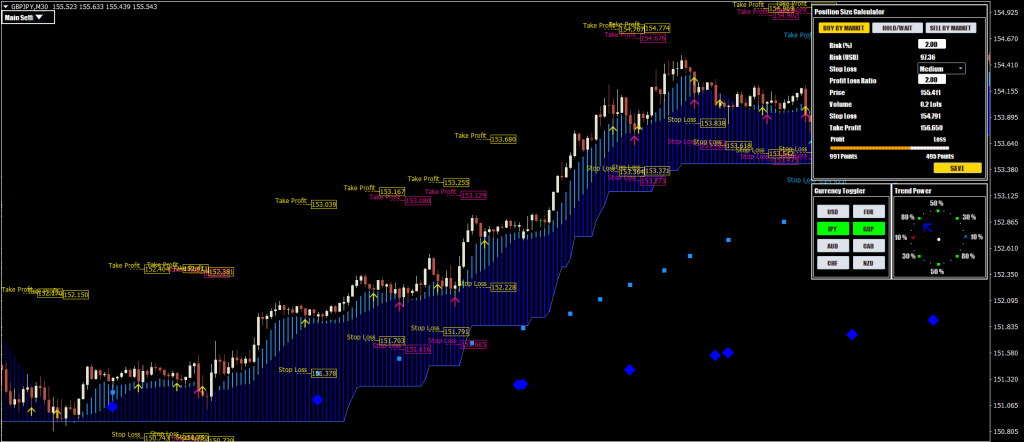
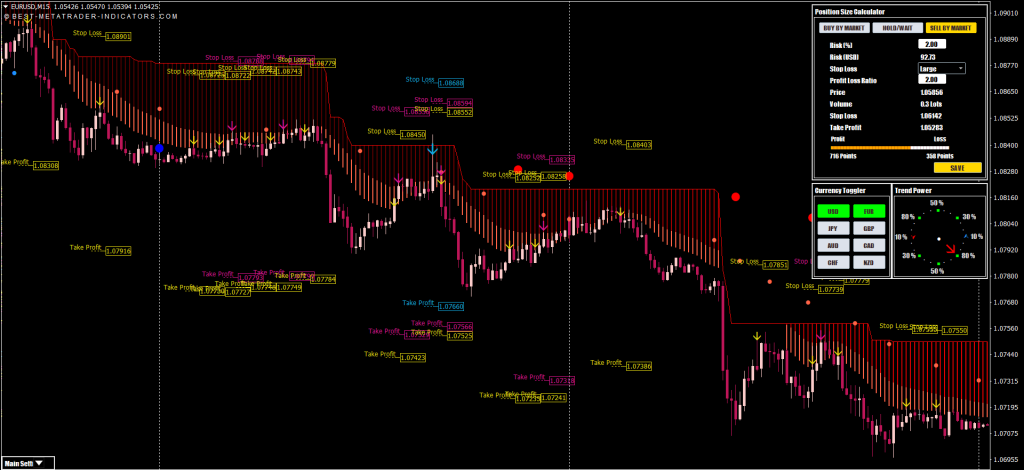
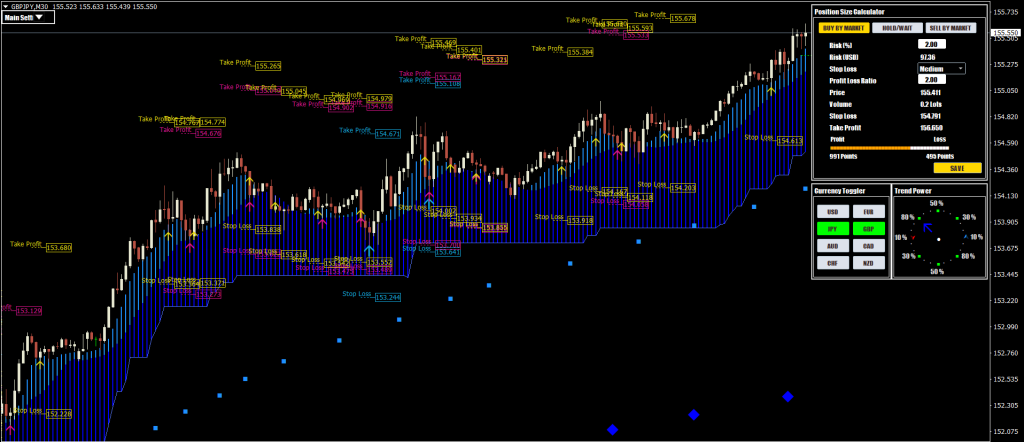
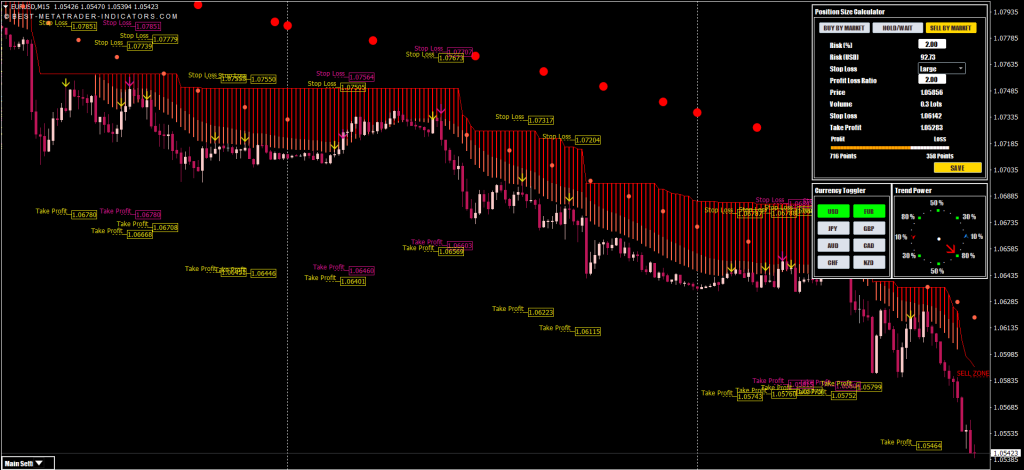
Take Your Trading to the Next Level and Start Profiting


Reliable MetaTrader Indicators
MT4 and MT5 versions available
Highly Accurate Signals
Non-Repainting for safe and efficient trading
Take Profit & Stop Loss Levels
Protect your capital and maximize your gains
Position Size Calculator
Automatic calculation of position size
All Sorts of Alarms
💡 Entry Levels with Lot Size
🪟 Pop-Up Alerts
🔔 Sound Alerts
📩 Email Alerts
📲 Push Notifications
For All Markets
💱 All Currency Pairs
📈 Stocks and Indices
🪙 Cryptocurrencies
📉 Derived Indices
📊 Commodities
More for You
⏬ Instant Download
🏧 No Hidden Fees
📖 Interactive guides
📨 First-class support
🔃 Free updates
🆕 We Understand What You Needs
✅ 2 unique strategies for beginners and professional traders
✅ Maximizing profits through integrated money management
✅ Early detection of market trends and reversals
✅ Buy and sell levels with ideal entry chances
✅ Timely profit taking through target levels
✅ Trailing stop loss levels to protect your profits
✅ A well-thought-out signals filter trading algorithm
✅ Built-in position size calculator
✅ Automatic non-repainting buy and sell signals (arrows)
✅ Automatic non-repainting take profit and stop loss levels
✅ Moveable, clickable and fillable panels (windows)
✅ Quickly switch between currency pairs with one click
✅ Our systems are extremely user-friendly and easy to use
✅ We are developing professional tools for the future
✅ Customer success is our top priority and guiding focus


💰 Profitable Signals for All Markets and Time Frames


💯 Non-Repainting, Non-Lagging and Highly Accurate


🛍️ What You Get for Your MT4 and MT5 Charts
2️⃣ Two professional trading systems for all markets, time frames and cycles
📦 Non-repainting and non-lagging indicators with custom templates
⬆️ Accurate buy and sell trading signals with arrows
🎯 Dynamic take profit levels to maximize your gains
🛡️ Smart stop loss levels to protect your capital
🤖 Professional expert advisor (EA) for backtesting
📈 Multi-currency correlation and trend strength tool
⚖️ Top-notch overbought/oversold oscillator
📟 Automatic position size calculator
🪟 Pop-up alerts
🔔 Sound alerts
📩 Email alerts
📲 Push notifications
⏬ Instant download after purchase
🧭 Quick and easy installation with user-friendly interface
🔓 Exclusive access to our community support portal
📖 Interactive multilingual guides and tips with FAQs
🔃 Free updates to new versions and features
📨 First-class support with quick responses
🎁 2 Systems Pack for Beginners
129 €
59 €
Our best package for experts can be found here »
⌚ Our biggest offer for you ends in a few days!